


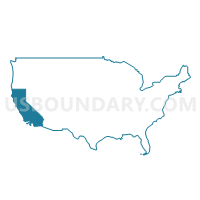
Congressional District 51, California
About
Outline

Summary
| Unique Area Identifier | 118693 |
| Name | Congressional District 51 |
| State | California |
| Area (square miles) | 4,895.97 |
| Land Area (square miles) | 4,583.52 |
| Water Area (square miles) | 312.45 |
| % of Land Area | 93.62 |
| % of Water Area | 6.38 |
| Latitude of the Internal Point | 33.01739230 |
| Longtitude of the Internal Point | -115.47690380 |
| Total Population | 757,891 |
| Total Housing Units | 232,778 |
| Total Households | 216,630 |
| Median Age | 32.6 |
Maps

Graphs
Select a template below for downloading or customizing gragh for Congressional District 51, California


Neighbors
Neighoring 111th Congressional District (by Name) Neighboring 111th Congressional District on the Map
- Congressional District 45, CA
- Congressional District 52, CA
- Congressional District 53, CA
- Congressional District 7, AZ
Top 10 Neighboring County (by Population) Neighboring County on the Map
- San Diego County, CA (3,095,313)
- Riverside County, CA (2,189,641)
- Yuma County, AZ (195,751)
- Imperial County, CA (174,528)
- La Paz County, AZ (20,489)
Top 10 Neighboring County Subdivision (by Population) Neighboring County Subdivision on the Map
- San Diego CCD, San Diego County, CA (2,259,481)
- Coachella Valley CCD, Riverside County, CA (180,693)
- Yuma CCD, Yuma County, AZ (138,997)
- El Centro CCD, Imperial County, CA (62,179)
- Calexico CCD, Imperial County, CA (39,216)
- Brawley CCD, Imperial County, CA (26,008)
- Parker CCD, La Paz County, AZ (20,489)
- Jamul CCD, San Diego County, CA (18,958)
- Blythe CCD, Riverside County, CA (15,045)
- Calipatria-Westmorland CCD, Imperial County, CA (12,248)
Top 10 Neighboring Place (by Population) Neighboring Place on the Map
- San Diego city, CA (1,307,402)
- Chula Vista city, CA (243,916)
- Yuma city, AZ (93,064)
- National City city, CA (58,582)
- El Centro city, CA (42,598)
- Calexico city, CA (38,572)
- La Presa CDP, CA (34,169)
- Spring Valley CDP, CA (28,205)
- Imperial Beach city, CA (26,324)
- Lemon Grove city, CA (25,320)
Top 10 Neighboring Elementary School District (by Population) Neighboring Elementary School District on the Map
- Chula Vista Elementary School District, CA (280,181)
- Cajon Valley Union Elementary School District, CA (160,974)
- La Mesa-Spring Valley School District, CA (130,979)
- Yuma Elementary District, AZ (99,267)
- South Bay Union Elementary School District, CA (75,823)
- National Elementary School District, CA (57,586)
- Crane Elementary District, AZ (43,266)
- San Ysidro Elementary School District, CA (41,488)
- El Centro Elementary School District, CA (38,593)
- Lemon Grove Elementary School District, CA (34,544)
Top 10 Neighboring Secondary School District (by Population) Neighboring Secondary School District on the Map
- Sweetwater Union High School District, CA (455,078)
- Grossmont Union High School District, CA (453,105)
- Yuma Union High School District, AZ (189,381)
- Central Union High School District, CA (57,817)
- Brawley Union High School District, CA (28,597)
- Bicentennial Union High School District, AZ (10,921)
- Julian Union High School District, CA (4,488)
Top 10 Neighboring Unified School District (by Population) Neighboring Unified School District on the Map
- San Diego City Unified School District, CA (1,015,433)
- Coachella Valley Unified School District, CA (85,553)
- Calexico Unified School District, CA (39,047)
- Palo Verde Unified School District, CA (24,294)
- Imperial Unified School District, CA (21,283)
- Mountain Empire Unified School District, CA (11,322)
- Calipatria Unified School District, CA (10,397)
- Holtville Unified School District, CA (8,467)
- Borrego Springs Unified School District, CA (3,869)
- San Pasqual Valley Unified School District, CA (3,464)
Top 10 Neighboring State Legislative District Lower Chamber (by Population) Neighboring State Legislative District Lower Chamber on the Map
- Assembly District 80, CA (546,875)
- Assembly District 78, CA (489,221)
- Assembly District 79, CA (447,439)
- Assembly District 77, CA (444,726)
- Assembly District 76, CA (437,975)
- State House District 24, AZ (207,694)
Top 10 Neighboring State Legislative District Upper Chamber (by Population) Neighboring State Legislative District Upper Chamber on the Map
- State Senate District 36, CA (1,036,001)
- State Senate District 40, CA (1,018,606)
- State Senate District 39, CA (897,570)
- State Senate District 24, AZ (207,694)
Top 10 Neighboring Census Tract (by Population) Neighboring Census Tract on the Map
- Census Tract 133.10, San Diego County, CA (28,960)
- Census Tract 100.14, San Diego County, CA (17,679)
- Census Tract 133.14, San Diego County, CA (14,837)
- Census Tract 456.04, Riverside County, CA (13,694)
- Census Tract 110, Imperial County, CA (12,047)
- Census Tract 119, Imperial County, CA (10,966)
- Census Tract 456.05, Riverside County, CA (10,543)
- Census Tract 113, Imperial County, CA (10,460)
- Census Tract 120.02, Imperial County, CA (9,678)
- Census Tract 133.13, San Diego County, CA (9,464)
Top 10 Neighboring 5-Digit ZIP Code Tabulation Area (by Population) Neighboring 5-Digit ZIP Code Tabulation Area on the Map
- 91911, CA (82,999)
- 92154, CA (79,708)
- 91910, CA (75,802)
- 85364, AZ (74,904)
- 92105, CA (69,813)
- 92114, CA (65,433)
- 91950, CA (60,322)
- 92115, CA (58,560)
- 91977, CA (58,368)
- 92113, CA (56,066)
Data
Demographic, Population, Households, and Housing Units
** Data sources from census 2010 **
Show Data on Map
Download Full List as CSV
Download Quick Sheet as CSV
| Subject | This Area | California | National |
|---|---|---|---|
| POPULATION | |||
| Total Population Map | 757,891 | 37,253,956 | 308,745,538 |
| POPULATION, HISPANIC OR LATINO ORIGIN | |||
| Not Hispanic or Latino Map | 284,667 | 23,240,237 | 258,267,944 |
| Hispanic or Latino Map | 473,224 | 14,013,719 | 50,477,594 |
| POPULATION, RACE | |||
| White alone Map | 368,828 | 21,453,934 | 223,553,265 |
| Black or African American alone Map | 57,064 | 2,299,072 | 38,929,319 |
| American Indian and Alaska Native alone Map | 7,600 | 362,801 | 2,932,248 |
| Asian alone Map | 96,437 | 4,861,007 | 14,674,252 |
| Native Hawaiian and Other Pacific Islander alone Map | 4,314 | 144,386 | 540,013 |
| Some Other Race alone Map | 184,199 | 6,317,372 | 19,107,368 |
| Two or More Races Map | 39,449 | 1,815,384 | 9,009,073 |
| POPULATION, SEX | |||
| Male Map | 376,936 | 18,517,830 | 151,781,326 |
| Female Map | 380,955 | 18,736,126 | 156,964,212 |
| POPULATION, AGE (18 YEARS) | |||
| 18 years and over Map | 545,845 | 27,958,916 | 234,564,071 |
| Under 18 years | 212,046 | 9,295,040 | 74,181,467 |
| POPULATION, AGE | |||
| Under 5 years | 55,504 | 2,531,333 | 20,201,362 |
| 5 to 9 years | 56,515 | 2,505,839 | 20,348,657 |
| 10 to 14 years | 60,522 | 2,590,930 | 20,677,194 |
| 15 to 17 years | 39,505 | 1,666,938 | 12,954,254 |
| 18 and 19 years | 25,541 | 1,157,002 | 9,086,089 |
| 20 years | 12,704 | 573,642 | 4,519,129 |
| 21 years | 12,252 | 555,775 | 4,354,294 |
| 22 to 24 years | 35,451 | 1,636,532 | 12,712,576 |
| 25 to 29 years | 54,580 | 2,744,409 | 21,101,849 |
| 30 to 34 years | 50,367 | 2,573,468 | 19,962,099 |
| 35 to 39 years | 51,640 | 2,573,579 | 20,179,642 |
| 40 to 44 years | 52,243 | 2,609,131 | 20,890,964 |
| 45 to 49 years | 52,115 | 2,689,819 | 22,708,591 |
| 50 to 54 years | 48,673 | 2,562,552 | 22,298,125 |
| 55 to 59 years | 40,489 | 2,204,296 | 19,664,805 |
| 60 and 61 years | 13,889 | 786,276 | 7,113,727 |
| 62 to 64 years | 18,118 | 1,045,921 | 9,704,197 |
| 65 and 66 years | 9,811 | 568,817 | 5,319,902 |
| 67 to 69 years | 12,941 | 734,741 | 7,115,361 |
| 70 to 74 years | 18,796 | 971,778 | 9,278,166 |
| 75 to 79 years | 15,308 | 766,971 | 7,317,795 |
| 80 to 84 years | 11,357 | 603,239 | 5,743,327 |
| 85 years and over | 9,570 | 600,968 | 5,493,433 |
| MEDIAN AGE BY SEX | |||
| Both sexes Map | 32.60 | 35.20 | 37.20 |
| Male Map | 31.00 | 34.00 | 35.80 |
| Female Map | 34.30 | 36.30 | 38.50 |
| HOUSEHOLDS | |||
| Total Households Map | 216,630 | 12,577,498 | 116,716,292 |
| HOUSEHOLDS, HOUSEHOLD TYPE | |||
| Family households: Map | 173,646 | 8,642,473 | 77,538,296 |
| Husband-wife family Map | 117,234 | 6,213,310 | 56,510,377 |
| Other family: Map | 56,412 | 2,429,163 | 21,027,919 |
| Male householder, no wife present Map | 14,653 | 752,347 | 5,777,570 |
| Female householder, no husband present Map | 41,759 | 1,676,816 | 15,250,349 |
| Nonfamily households: Map | 42,984 | 3,935,025 | 39,177,996 |
| Householder living alone Map | 33,764 | 2,929,442 | 31,204,909 |
| Householder not living alone Map | 9,220 | 1,005,583 | 7,973,087 |
| HOUSEHOLDS, HISPANIC OR LATINO ORIGIN OF HOUSEHOLDER | |||
| Not Hispanic or Latino householder: Map | 97,639 | 9,192,322 | 103,254,926 |
| Hispanic or Latino householder: Map | 118,991 | 3,385,176 | 13,461,366 |
| HOUSEHOLDS, RACE OF HOUSEHOLDER | |||
| Householder who is White alone | 113,981 | 8,129,331 | 89,754,352 |
| Householder who is Black or African American alone | 18,312 | 835,651 | 14,129,983 |
| Householder who is American Indian and Alaska Native alone | 2,321 | 113,235 | 939,707 |
| Householder who is Asian alone | 26,238 | 1,529,789 | 4,632,164 |
| Householder who is Native Hawaiian and Other Pacific Islander alone | 1,150 | 38,238 | 143,932 |
| Householder who is Some Other Race alone | 46,372 | 1,497,993 | 4,916,427 |
| Householder who is Two or More Races | 8,256 | 433,261 | 2,199,727 |
| HOUSEHOLDS, HOUSEHOLD TYPE BY HOUSEHOLD SIZE | |||
| Family households: Map | 173,646 | 8,642,473 | 77,538,296 |
| 2-person household Map | 43,005 | 2,887,696 | 31,882,616 |
| 3-person household Map | 37,968 | 1,904,697 | 17,765,829 |
| 4-person household Map | 39,830 | 1,823,355 | 15,214,075 |
| 5-person household Map | 26,713 | 1,018,257 | 7,411,997 |
| 6-person household Map | 13,415 | 497,773 | 3,026,278 |
| 7-or-more-person household Map | 12,715 | 510,695 | 2,237,501 |
| Nonfamily households: Map | 42,984 | 3,935,025 | 39,177,996 |
| 1-person household Map | 33,764 | 2,929,442 | 31,204,909 |
| 2-person household Map | 6,721 | 766,106 | 6,360,012 |
| 3-person household Map | 1,371 | 139,115 | 992,156 |
| 4-person household Map | 586 | 60,096 | 411,171 |
| 5-person household Map | 272 | 22,151 | 126,634 |
| 6-person household Map | 138 | 9,698 | 48,421 |
| 7-or-more-person household Map | 132 | 8,417 | 34,693 |
| HOUSING UNITS | |||
| Total Housing Units Map | 232,778 | 13,680,081 | 131,704,730 |
| HOUSING UNITS, OCCUPANCY STATUS | |||
| Occupied Map | 216,630 | 12,577,498 | 116,716,292 |
| Vacant Map | 16,148 | 1,102,583 | 14,988,438 |
| HOUSING UNITS, OCCUPIED, TENURE | |||
| Owned with a mortgage or a loan Map | 95,494 | 5,465,345 | 52,979,430 |
| Owned free and clear Map | 25,174 | 1,570,026 | 23,006,644 |
| Renter occupied Map | 95,962 | 5,542,127 | 40,730,218 |
| HOUSING UNITS, VACANT, VACANCY STATUS | |||
| For rent Map | 5,578 | 374,610 | 4,137,567 |
| Rented, not occupied Map | 269 | 20,347 | 206,825 |
| For sale only Map | 3,053 | 154,775 | 1,896,796 |
| Sold, not occupied Map | 625 | 34,288 | 421,032 |
| For seasonal, recreational, or occasional use Map | 2,920 | 302,815 | 4,649,298 |
| For migrant workers Map | 31 | 2,100 | 24,161 |
| Other vacant Map | 3,672 | 213,648 | 3,652,759 |
| HOUSING UNITS, OCCUPIED, AVERAGE HOUSEHOLD SIZE BY TENURE | |||
| Total: Map | 3.39 | 2.90 | 2.58 |
| Owner occupied Map | 3.43 | 2.95 | 2.65 |
| Renter occupied Map | 3.33 | 2.83 | 2.44 |
| HOUSING UNITS, OCCUPIED, TENURE BY RACE OF HOUSEHOLDER | |||
| Owner occupied: Map | 120,668 | 7,035,371 | 75,986,074 |
| Householder who is White alone Map | 68,804 | 4,996,053 | 63,446,275 |
| Householder who is Black or African American alone Map | 8,583 | 310,834 | 6,261,464 |
| Householder who is American Indian and Alaska Native alone Map | 1,194 | 52,963 | 509,588 |
| Householder who is Asian alone Map | 16,937 | 878,924 | 2,688,861 |
| Householder who is Native Hawaiian and Other Pacific Islander alone Map | 584 | 16,570 | 61,911 |
| Householder who is Some Other Race alone Map | 20,438 | 589,196 | 1,975,817 |
| Householder who is Two or More Races Map | 4,128 | 190,831 | 1,042,158 |
| Renter occupied: Map | 95,962 | 5,542,127 | 40,730,218 |
| Householder who is White alone Map | 45,177 | 3,133,278 | 26,308,077 |
| Householder who is Black or African American alone Map | 9,729 | 524,817 | 7,868,519 |
| Householder who is American Indian and Alaska Native alone Map | 1,127 | 60,272 | 430,119 |
| Householder who is Asian alone Map | 9,301 | 650,865 | 1,943,303 |
| Householder who is Native Hawaiian and Other Pacific Islander alone Map | 566 | 21,668 | 82,021 |
| Householder who is Some Other Race alone Map | 25,934 | 908,797 | 2,940,610 |
| Householder who is Two or More Races Map | 4,128 | 242,430 | 1,157,569 |
| HOUSING UNITS, OCCUPIED, TENURE BY HISPANIC OR LATINO ORIGIN OF HOUSEHOLDER | |||
| Owner occupied: Map | 120,668 | 7,035,371 | 75,986,074 |
| Not Hispanic or Latino householder Map | 62,306 | 5,529,138 | 69,617,625 |
| Hispanic or Latino householder Map | 58,362 | 1,506,233 | 6,368,449 |
| Renter occupied: Map | 95,962 | 5,542,127 | 40,730,218 |
| Not Hispanic or Latino householder Map | 35,333 | 3,663,184 | 33,637,301 |
| Hispanic or Latino householder Map | 60,629 | 1,878,943 | 7,092,917 |
| HOUSING UNITS, OCCUPIED, TENURE BY HOUSEHOLD SIZE | |||
| Owner occupied: Map | 120,668 | 7,035,371 | 75,986,074 |
| 1-person household Map | 16,250 | 1,340,915 | 16,453,569 |
| 2-person household Map | 30,278 | 2,269,063 | 27,618,605 |
| 3-person household Map | 21,341 | 1,164,562 | 12,517,563 |
| 4-person household Map | 22,780 | 1,129,739 | 10,998,793 |
| 5-person household Map | 14,860 | 577,673 | 5,057,765 |
| 6-person household Map | 7,604 | 273,058 | 1,965,796 |
| 7-or-more-person household Map | 7,555 | 280,361 | 1,373,983 |
| Renter occupied: Map | 95,962 | 5,542,127 | 40,730,218 |
| 1-person household Map | 17,514 | 1,588,527 | 14,751,340 |
| 2-person household Map | 19,448 | 1,384,739 | 10,624,023 |
| 3-person household Map | 17,998 | 879,250 | 6,240,422 |
| 4-person household Map | 17,636 | 753,712 | 4,626,453 |
| 5-person household Map | 12,125 | 462,735 | 2,480,866 |
| 6-person household Map | 5,949 | 234,413 | 1,108,903 |
| 7-or-more-person household Map | 5,292 | 238,751 | 898,211 |
Loading...